Statistical process control (SPC) is a systematic decision making tool which uses statistical-based techniques to monitor and control a process to advance the quality or uniformity of the output of a process – usually a manufacturing process. It is commonly used in industry to measure the productivity or to measure, track and improve the ongoing performance of a process or determine if the process is in control or not.
The significance of SPC Software is that by monitoring the process and bringing the process under statistical control to identify and take action on special causes of variation. SPC is supportive to maximize the overall profit by improving product quality, improving productivity, streamlining process, improving customer service, etc.
Steps involved in using Statistical Process Control (SPC) :
Plan: First identify the root cause of the problem and take corrective action to that problem. A corrective action is an immediate action as soon as the problem is identified.
Experiment / Research: When problem occurs SPC software helps to analyze and empowers you to make better engineering decisions easily and quickly throughout the product development life cycle.
Analyze: With the help of digitalized test data have a complete view of the manufacturing metrics and try to spell out all of the possible issues and send the data to R&D thereby improving product quality and customer satisfaction.
Act: If the result is successful then work on additional improvements. If the result is not yet successful then the look for other ways to change the process.
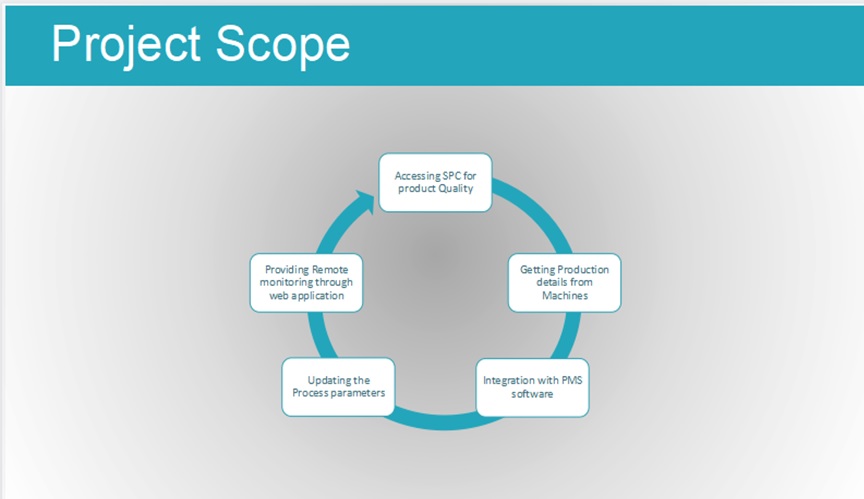
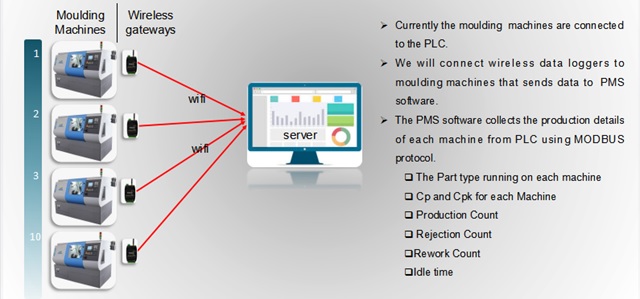
Getting SPC Data From Machines
Getting Production Details From Machines
Integration with Production Management System
The PMS application can have the below provisions:
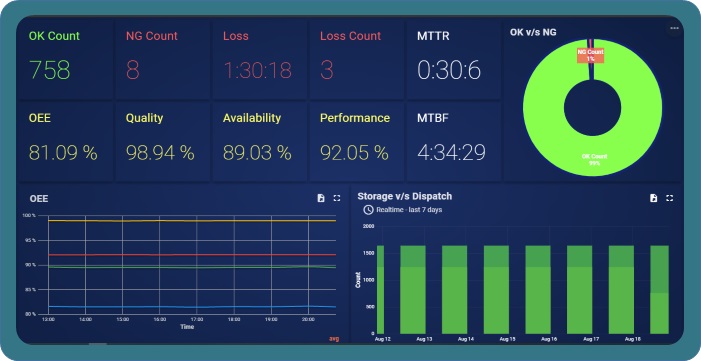
Real time efficiency calculation
Downtime analysis
High speed production counter
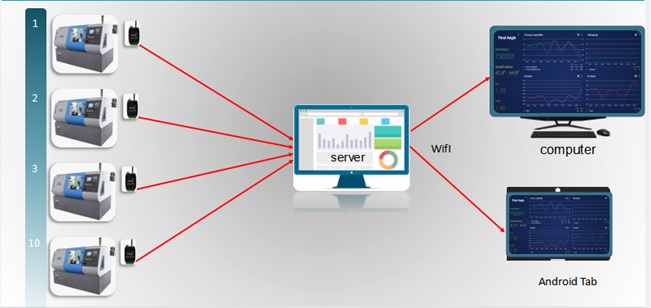
Enables the cloud based monitoring by sending data to the web application.
Setting machine level targets against the production order.
SPC ADVANTAGES
Helps in improving quality , traceability of the part, reducing the no. of rejections Continuous monitoring.
Automated process leaving minimal room for manual error.
Enables adherence to regulatory guidelines & achieve operational excellence and effectiveness.
Provides wide functionality to adapt, configure and extend capabilities.
Provides faster implementation to results.
Flexible and scalable application architecture enabling integration from single line to multiple lines.
Provides centralization platform for data analytics.
Provides Data Storage and expansion capability which is configurable based on customer requirements.
Web Application for Remote monitoring
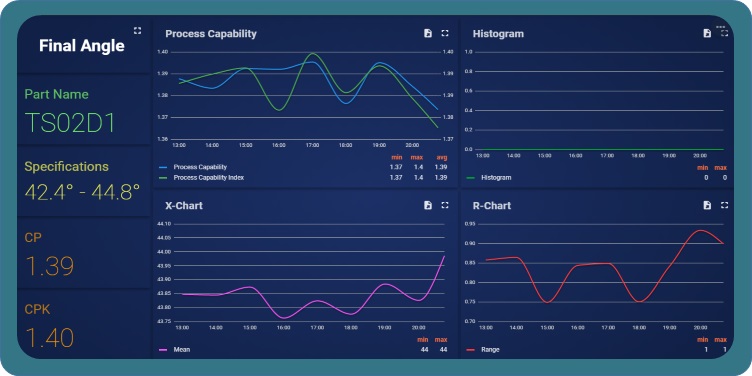
The SPC APP will sends the real time production data to the Web Application
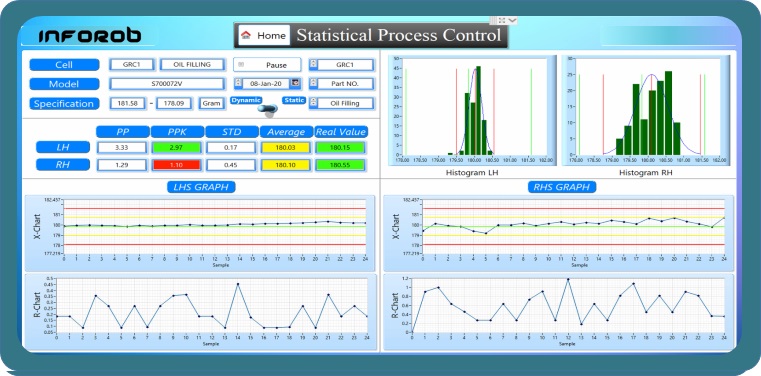
X-chart and R-chart will show the specifications as measured and deviation from the specifications.
Cp and Cpk Values will be notified in real time.
The home screen is a rotating display which reads Oil filling and Torquing data from machine and plots the graphs according to the specifications.
We can make the screen static by moving the button from dynamic to static and then selecting the date, line and application for which data is to be analyzed.
Rational Subgroups
A rational subgroup is a group of measurements produced under the same set of conditions. Subgroups are meant to represent a snapshot of your process. Therefore, the measurements that make up a subgroup should be taken from a similar point in time. For example, if you sample 5 items every hour, your subgroup size would be 5.
Here in X-chart and R-chart subgroup size is 5 and 25 latest points are plotted on the graph.
Process Capability (Pp)
How do you know if your process is capable? Process Capability Pp measures the process spread vs the specification spread. In other words, how distributed the outcome of your process is vs what the requirements are.
Calculating Process Capability (Pp)
Pp = (USL – LSL) / 6* s : where s the standard deviation, or the ‘fatness’ or dispersion of the bell curve.
What is a ‘Good’ Process Capability (Pp) Number?
According to Six Sigma, we want a Pp of above 1.5 because that would reflect a process with less than 3.4 DPMO – the definition of 6 Sigma quality.
Process Capability Index (Ppk)
Ppk is another performance index that measures how close the current process mean’s proximity is to the specification limits. In other words, does this process deliver acceptable results?
Calculating Ppk
There are 2 ways to calculate Ppk, depending on how your process is aligning.
Process Mean close to USL
If your Process Mean (central tendency) is closer to the USL, use: Ppk = [ USL – x(bar) ] / 3 s, where x(bar) is the Process Mean.
Process Mean close to LSL
If your Process Mean (central tendency) is closer to the LSL, use: Ppk = [x(bar) – LSL ] / 3 s, where x(bar) is the Process Mean.
Interpreting Ppk Scores
A Ppk of 1 means that there is “half of a bell curve” between the center of the process and the nearest specification limit. That means your process is completely centered.
What are X-Bar R-Control Charts?
X Bar R charts are the widely used control chart for variable data to examine the process stability in many industries (like Hospital patients’ blood pressure over time, customer call handle time, length of the part in production process etc.,).
X bar R chart is used to monitor the process performance of a continuous data and the data to be collected in subgroups at a set time periods. It is actually a two plots to monitor the process mean and the process variation over the time and is an example of statistical process control. These combination charts helps to understand the stability of processes and also detects the presence of special cause variation.
X-bar chart: The mean or average change in process over time from subgroup values. The control limits on the X-Bar brings the sample’s mean and center into consideration.
R-chart: The range of the process over the time from subgroups values. This monitors the spread of the process over the time.